Responses Table widget allows you to present a summary of the response results in a Table view.

This Table view comes with all the key metrics you would need to track responses with the ability to drill down on the number to see which customers fall into which bucket. This powerful widget comes in two versions - to be able to see the information by Date or by a preferred Segment Value.
Metrics Available:
#Delivered
#Responses, Response %
#Non Response, Non Response %
#Primary Response, Primary Response%
#Reminder Delivered, Reminder Delivered%
#Reminder Response, Reminder Response%
Widget notes:
- This widget has global data access restriction option
- Delivered (Delivered = number of invitations successfully delivered to customers).
- Response Rate is calculated on Delivered Numbers (Net Response %)
- All Percentages will now show 1 decimal and will sum to 100%
- The number of Passives will not include "No scores"
- The drill down (click on a number) will allow exporting of the complete data
Adding the Widget
Add the widget to your report clicking on New Widget and navigating to Widget Type or searching for Widget Name
Date/Segment Filter Settings:

- The widget comes with standard Date and Segment filter settings
- The widget allows "IS NOT" criteria in Segment filtering
Group by Settings:
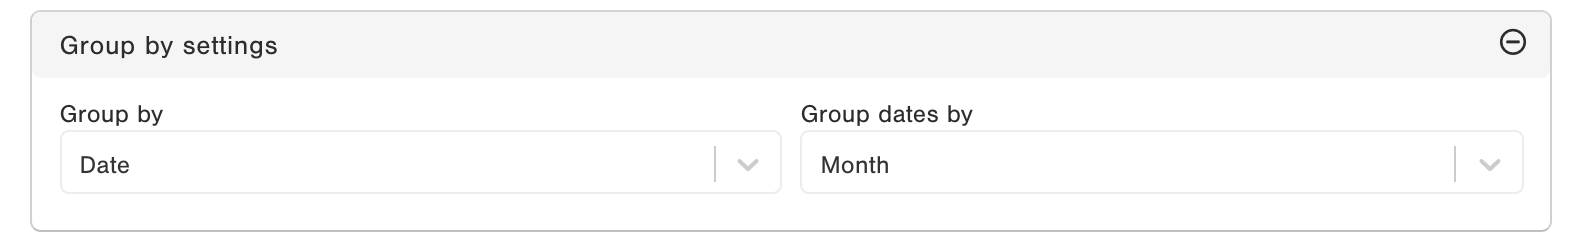
- In the Group by setting you can choose if you would like to see the information by Dates or by a Segment.
- Choosing Dates will allow you to choose by what dates you want to see the information - Year, Quarter, Month, Week, Day
- Choosing Segment will allow you to choose by which Segment you would see the information - For Example Group by Segment = "Client".
Additional Settings:

In the additional setting section, you have two options - NPS Loyalty Filter and Metrics to Display
- NPS Loyalty Filter allows you to choose for which Loyalty you would like to see the information. Leaving it blank will mean it shows the information for all Loyalties.
- Metrics to Display allows you to select which Metrics you would like to display as columns on your table.
Metrics calculation:
- Delivered: Number of invitations successfully delivered to customers.
- Reminder Delivered: The rate is calculated dividing the # of Reminders Delivered by the # of Delivered.
- Responses: Number of surveys answered. The rate is calculated dividing the # of Responses by # of Delivered. The Response Rate includes all responses even No Scores.
- Primary Responses: The rate is calculated dividing the # of Primary Responses by the # of Responses.
- Reminder Responses: The rate is calculated dividing the # of Reminder Responses by the # of Responses.